
Nirma University Journal of Business and Management Studies


Rasmita Nayak1 and Bimal K. Sahoo2
1Institute of Management, Nirma University, Ahmedabad, Gujarat, India
2Department of Humanities and Social Sciences, Indian Institute of Technology, Kharagpur, West Bengal, India

This article is distributed under the terms of the Creative Commons Attribution-NonCommercial 4.0 License (https://creativecommons.org/licenses/by-nc/4.0/) which permits non-commercial use, reproduction and distribution of the work without further permission provided the original work is attributed as specified on the SAGE and Open Access page (https://us.sagepub.com/en-us/nam/open-access-at-sage).
The COVID-19 pandemic severely impacted the tourism sector, disrupting livelihoods, public services, and the global economy. Travel restrictions reduced travel flows, altering household spending patterns and hindering tourism-driven economic growth. Despite its significance, limited micro-level research exists on this issue. This study examines the impact of COVID-19 on tourism spending by Indian households using Consumer Pyramids Household Survey data and a difference-in-differences (DID) approach. Findings reveal a 34% decline in average tourism expenditure post-pandemic, with rural areas experiencing a sharper 62% drop compared to urban regions. While key determinants of tourism spending remain significant, gender does not appear to influence expenditure. These insights offer valuable guidance for policymakers and tourism professionals in understanding household tourism behavior and formulating targeted strategies to revive the sector in the post-crisis era.
COVID-19, Domestic Tourism Expenditure, Difference-in-difference Analysis, -test, PSM, India
Introduction
Prior to the COVID-19 era, numerous studies had recognized the tourism industry’s contribution to economic growth in both developed and developing countries (Dritsakis, 2004; Eugenio-Martin et al., 2004; Inchausti-Sintes, 2015; Shi & Li, 2017), citing its positive long-term correlation with GDP (Banday & KOCOGLU, 2015; Lee & Chang, 2008), employment, foreign exchange earnings, revenue generation, social and economic infrastructure development, gender gap mitigation, and women empowerment (Athma & Nalini, 2013; Dwyer et al., 2004; Khan et al., 1990; Ohlan, 2017; Tang & Abosedra, 2016; WTTC, 2021b). However, the pandemic has caused not only a global health disaster but also an economic crisis (Haryanto, 2020), with profound impacts on the growth structure of the tourism industry in emerging markets like India. The first COVID-19 case in India was reported in January 2020 (PIB, 2020), followed by a nationwide lockdown and restrictions on travel, which significantly slowed down the economy’s expansion and devastated the tourism sector (Kukanja et al., 2020; Shretta, 2020; Uğur & Akbıyık, 2020; Shao et al., 2021; Singh et al., 2021; Uglis et al., 2022). Additionally, many countries closed their borders, resulting in a 49.1% drop in GDP contribution and a direct employment loss of 18.5% (61.6 million jobs) in the tourism industry. In India, the tourism sector’s contribution to GDP declined by 36.3% in 2020 in comparison to the previous year, coupled with a 20.8% reduction in employment. Both foreign and domestic tourist expenditures declined by 61% and 30.7%, respectively (WTTC, 2021a). Hence, to gain a better understanding of the situation and the pandemic’s effects on the travel industry, it is crucial to investigate the current tourism scenario and expenditure status, particularly at the micro-level. This information can help policymakers and tourism practitioners manage the pandemic’s current and future impacts on the industry effectively. Therefore, adding the COVID-19 pandemic as one of the essential determinants in the households’ tourism spending model is imperative to avoid misspecification. Otherwise, this might lead to faulty results and inadequate policy recommendations.
Thus, modeling the pre- and post-COVID-19 impact on domestic tourist spending in India can be a significant issue in tourism research. While the growth of the tourism industry has attracted significant attention from scholars and practitioners, including studies exploring the factors that influence households’ tourism spending (Brida & Scuderi, 2013; Cai, 1999; Lin et al., 2021; Nayak et al., 2022; Sahoo et al., 2022), there is limited knowledge on the impact of COVID-19. Therefore, our study aims to evaluate the effect of the pandemic on domestic visitors’ spending in India. Although the number of tourists may decline, their average spending on tourism may increase due to several reasons. Firstly, tourists may spend more on safety-related measures. Secondly, low-income households are disproportionately affected by the pandemic, meaning that only higher-income households may be able to undertake tourism. As income is positively associated with tourism expenditure, the higher-income traveler spending is likely to be higher, tourism being a necessary good for them (Sahoo et al., 2022). Moreover, the COVID-19 restrictions may lead to feelings of despair, anxiety, boredom, frustration, dread, sadness, and rage (Girish, 2021; Wang & Xia, 2021), which could increase people’s desire to travel (Boto-Garcia & Leoni, 2021; Cretu et al., 2021; Ivanova et al., 2021). This desire has led to the phenomenon of “revenge tourism” (Abdullah, 2021; Girish, 2021; Guerra et al., 2024), where people travel to overcome lockdown fatigue, leading to an increase in the number of tourists.
However, this research contributes to the limited literature on the determinants of domestic tourism spending in Indian households in three ways. First, this study incorporates the COVID-19 period, which witnessed a lower growth in the Indian tourism industry. But the literature on the analysis of domestic tourism spending of Indian households during the pre- and post-COVID-19 pandemic remains limited. Second, this study also investigates the impacts of pre- and post-COVID-19 outbreaks on tourism spending in rural and urban households in India. Third, this research employs the difference-in-difference (DID) method to model these research gaps.
Based on the above discussion, the following hypotheses need to be empirically tested:
H1: COVID-19 has no significant impact on domestic tourism spending.
H2: There is no difference in the impact of COVID-19 on tourism spending between rural and urban households.
The structure of this study is as follows. The second section presents a review of the relevant literature. The third section outlines the methodology and describes the dataset used in the analysis. The fourth section analyzes and presents the empirical results. Finally, the fifth section provides a conclusion to the study.
Literature Review
Tourism is one of the most affected sectors by crises and health shocks/pandemics, whether global or regional. Previously, diseases like Ebola (Maphanga & Henama, 2019; Novelli et al., 2018), SARS (Au et al., 2005; Cooper, 2006; Dombey, 2004; Kuo et al., 2008; McKercher & Chon, 2004), MERS (Joo et al., 2019; Kim, 2017), and Swain flu (Haque & Haque, 2018; Page et al., 2012) had influenced the tourism industry harshly, causing a drop in tourism demand, visitor arrivals (Cahyanto et al., 2016; Kuo et al., 2008; Page et al., 2012; Shi & Li, 2017), and tourism expenditure. Tourism is a very competitive industry, and the spread of these infectious diseases has a detrimental influence on tourism growth (Sifolo & Sifolo, 2015).
The global outbreak of COVID-19 has resulted in a devastating impact on the world economy, with the tourism industry being one of the most severely affected sectors (Arbulú et al., 2021; Shretta, 2020; Singh et al., 2021; Škare et al., 2021; UNWTO, 2021). Due to its sensitivity to disasters, external hazards and health crises (Arbulú et al., 2021; Williams & Baláž, 2015), tourism has always been vulnerable, and COVID-19 has only aggravated this situation. The fear of COVID-19 and the restrictions imposed to control its spread have led to a rapid decline in tourist arrivals (Cahyanto et al., 2016; Kuo et al., 2008; Page et al., 2012; Shi & Li, 2017; Singh et al., 2021; UNWTO, 2021) and have created uncertainty about future travel behavior (Binder, 2020; Foo et al., 2021; Immordino et al., 2022; Karl et al., 2021; Kock et al., 2020; Li et al., 2020; Miao et al., 2021; Rutynskyi & Kushniruk, 2020; Singh et al., 2020; Uglis et al., 2022; Uğur & Akbıyık, 2020). Consequently, there has been a decrease in tourism consumption expenditure, leading to a negative impact on tourism revenue, output, employment, and GDP, which has changed the dynamics of the economic growth cycle (Arbulú et al., 2021; Blake et al., 2003; Günay et al., 2020; Mariolis et al., 2021; Rosselló et al., 2017; Škare et al., 2021).
People were encouraged to stay at home to prevent the spread, leading to a sharp decline in all categories of spending (Alexander & Karger, 2020). However, the travel, entertainment, and restaurant sectors have been particularly hard hit (Baker et al., 2020; Chen et al., 2021), while groceries, food, and stockpiles have seen increased demand (Chronopoulos et al., 2020). Consumer demand, as well as consumption, were falling as a consequence of the fear effects: uncertainty, unsafe, anxious behavior, and economic effect of employment and income loss due to COVID restrictions (Bae & Chang, 2021; Chen et al., 2021; Coibion et al., 2020; Cox et al., 2020; Martin et al., 2020; Neuburger & Egger, 2021). Such a pandemic typically crashes both the demand and supply sides in most economic activities, but travel and tourism are mostly affected by the demand side (Arbulú et al., 2021; Blake et al., 2003; Gupta & Kishore, 2021; Nyarko et al., 2015; Rosselló et al., 2017).
Moreover, due to the risk of infection and the economic impact caused by job and income loss (Bartik et al., 2020; Dreger & Gros, 2021; Parvathamma, 2020), people were compelled to delay or cancel their travel plans, resulting in a decline in travel demand (Foo et al., 2021; Immordino et al., 2022; Rutynskyi & Kushniruk, 2020; Singh et al., 2021; Uglis et al., 2022; Uğur & Akbıyık, 2020). In addition, even if they had made plans, spending on vacation, dining out, and entertainment fell significantly. However, Wen et al. (2020) discovered that travelers may have reduced the number of their plans but spent more than they would have in the pre-COVID-19 time. Furthermore, Baños-Pino et al. (2023) found that travel expenditures remained consistent before and after the COVID-19 outbreak for each person and each day, with minor changes in the categories of their travel expenses. But Guerra et al. (2024) found that there is a higher tourism spending due to more expenses on side goods like food and beverages and for safety purposes.
Despite some research, there is still uncertainty about the impact of COVID-19 on domestic tourism spending in India and other emerging market economies, as some research has produced conflicting views on whether it has risen, dropped, or remained unchanged. Therefore, further investigation is needed in this area. While several studies have examined how COVID-19 affects total household consumption, there has been little direct investigation into its impact on domestic travel spending, particularly in India. Hence, this study aims to fill this gap in the literature by evaluating the effect of COVID-19 on domestic tourism expenditure.
Data and Methodology
Data
The current study utilizes data from the Consumer Pyramids Household Survey (CPHS), conducted by the Centre for Monitoring Indian Economy (CMIE) using a multi-stage stratification method in India. Primary sampling units are villages and towns from the 2011 Census, while households serve as the ultimate sampling units. The CPHS provides information about household characteristics, such as age, gender, education, occupation and family size, along with the various types of consumption. To analyze the objective, the study used vacation spending data from March 2019 to February 2021, covering a period of one year before and after the COVID-19 lockdown.
Methodology
DID Model
This study employs a DID model to estimate the impact of COVID-19 on domestic tourism spending in India. It is a quasi-experimental design that originated in the field of econometrics to measure the causal inference even when randomization is not possible and it is better than a simple time-series analysis, showing a logical before-and-after and treatment-control group comparisons (Fredriksson & Oliveira, 2019; Waldfogel, 1999). DID is commonly used to assess the impact of a given intervention or therapy on a collection of persons over time by examining the changes in the outcomes (Baker et al., 2020; Villa, 2012). The approach makes use of longitudinal data (panel data or repeated cross-sections) from treatment and control groups for effect evaluations by comparing the before-and-after changes.
Precisely, the framework is presented in Equation (1).
Here TEgt is the outcome variable (tourism expenditure) of both treatment (Tg = 1, i.e., TE > 0) and control groups (Tg = 0, i.e., TE = 0), and Pgt shows the pre-treatment (before COVID-19) and post-treatment period (after COVID-19). The basic DID framework is dependent on the availability of two groups of units g, including a treated group to which the treatment is delivered (Pgt = 1) and a control group to which the treatment is not delivered (Pgt = 0). Equation (1) is the single DID structure without any covariates. However, the analysis can include covariates (Xg) like region type, gender, age, education, occupation, and household size and can be written as follows:
We estimate the following equation as a DID model:
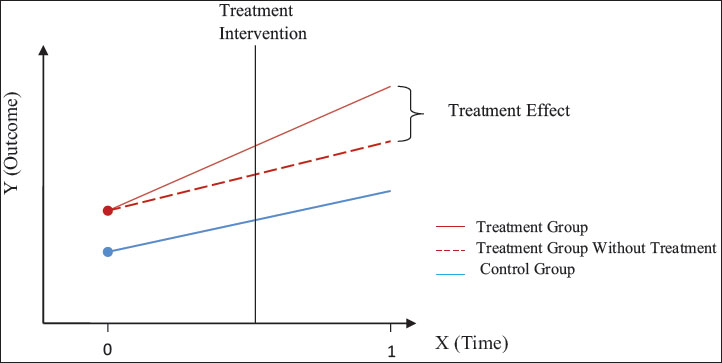
where TEgt stands for tourism expenditure in continuous form for time t and group g (treatment—T and control—C group) of both pre- (March 2019 to February 2020) and post-COVID-19 periods (March 2020 to February 2021). Here, T (treated) is the dummy variable equal to “1” for the households that have tourism spending and “0” otherwise. P is a dummy variable, where “1” stands for the COVID-19 time and “0” otherwise. While β1 is the treatment coefficient, β2 measures the time trend change in tourism consumption expenditure for both the treatment and control groups. The coefficient of the interaction term, β3, gives us our DID estimator or the treatment effect.
Assumptions
The following are the two important DID assumptions to generate an unbiased, reliable assessment of the treatment effect.
(1) The error term is distributed independently of the covariates and has an expectation of zero.
(2) The difference between the “treatment” and “control” groups should remain consistent over time in the absence of treatment. This is also known as the parallel trend assumption.
DID Estimator
As per the above assumptions, the expected values of outcomes, TEgt, are explained as follows:
The single difference estimator comparing pre- and post-period differences only in the treatment group is explained as follows:
Therefore, if there is a time trend, the estimator will be biased since we may consider the time trend to be a component of the treatment effect.
So we consider another estimator that compares the average difference between the treatment and control groups.
is also found to be biased, caused by specific group effects.
Precisely, DID estimator = (Before-and-after difference in average outcome in treated group) (Before-and-after difference in average outcome in the control group).
The model can also include control variables, explained as follows:
where Xgk includes the matrix of household-level control variables, like the composition of region type, gender, age, education, occupation, and household size. This study checked multicollinearity among control variables through the estimation of the variance inflation factor (VIF). All the VIF values are less than 3, indicating no severe multicollinearity among the variables. εgt is the error term consisting of unobservable factors. Figure 1 shows the graphical explanation of the model.
For robustness checks 1 and 2, we ran a t-test and a propensity score matching (PSM) analysis for the same data set for the above two time periods, respectively. PSM is a quasi-experimental technique that helps to reduce the biasedness and corrects the estimation of treatment effects by comparing the outcomes of the most possible similar treated and control subjects by controlling for the existence of confounding factors (Caliendo & Kopeinig, 2008; Rubin, 1980).
Result and Discussion
Household Characteristics
The dataset comprises 69.04% and 30.96% of the urban and rural households. We have classified households into three gender groups: male-dominated, female-dominated, and balanced gender groups. The female-dominated homes accounted for 41.27% of the total sampled households, followed by the male-dominated, that is, 34.33%, and the remaining samples reflect more of a balanced character (Table 1).
| Observations: 97,678 | Category | Mean | SD | Min | Max |
| Region | Rural | 0.310 | 0.462 | 0 | 1 |
| Urban | 0.690 | 0.462 | 0 | 1 | |
| Gender1 | Male dominated | 0.343 | 0.475 | 0 | 1 |
| Female dominated | 0.413 | 0.492 | 0 | 1 | |
| Balanced | 0.244 | 0.430 | 0 | 1 | |
| Age | Young dominated | 0.199 | 0.400 | 0 | 1 |
| Grownups dominated | 0.533 | 0.499 | 0 | 1 | |
| Balanced age | 0.268 | 0.443 | 0 | 1 | |
| Education | Better educated | 0.340 | 0.474 | 0 | 1 |
| Moderately educated | 0.270 | 0.444 | 0 | 1 | |
| Least educated | 0.390 | 0.488 | 0 | 1 | |
| Occupation | Business | 0.284 | 0.451 | 0 | 1 |
| Salaried | 0.247 | 0.431 | 0 | 1 | |
| Farmers | 0.148 | 0.355 | 0 | 1 | |
| Small traders and daily wage earners | 0.222 | 0.416 | 0 | 1 | |
| Miscellaneous | 0.099 | 0.299 | 0 | 1 | |
| Households | 1–5 members | 0.871 | 0.336 | 0 | 1 |
| 6–10 members | 0.128 | 0.334 | 0 | 1 | |
| >10 members | 0.002 | 0.039 | 0 | 1 |
Young dominated (more than 50% of the total members of the family are of 0-25 years) comprises 19.93% of the whole sample, while grownups dominated (26-60 years) consist of 53.29%. The balanced household includes both young dominated and grownup dominated, constituting 26.78% of households. The “better educated” group includes graduate members with all matriculates (34%), while the moderately educated group includes households with most of the members having a matriculation level of education only. The least-educated houses are those where some of the members are just literate or have no education at all; most of the families belong to this group (39.04%). Households with business occupations contribute 28.38% of the total sample, followed by salaried, farmers, merchants, and wage earners, and the miscellaneous category with 24.69%, 14.81%, 22.23% and 9.89%, respectively. In the sample, most of the households consist of 1-5 members (87.07%), followed by 6-10 members (12.78%) and more than 10 members (0.16%).
DID Analysis Result
Table 2 exhibits the empirical results before and after the COVID-19 pandemic comparing the travel expenditure covered by the treatment group (TE > 0). The model result reveals that the DID estimator is negative and statistically significantly linked with the outcome variable, that is, tourist spending. The average tourist expenditure dropped by ₹747.67 in comparison to the pre-COVID-19 year. The tourism expenditures in rural (Table 3) and urban (Table 4) areas have decreased by ₹1,179.43 and ₹691.35, respectively. The reduction in rural areas is greater than that in urban areas, which could be attributable to a lack of safe transport amenities and increased COVID-19 spread. The imposition of a national lockdown, travel bans, social isolation, etc., has had a significant and immediate impact on unemployment (Bartik et al., 2020; Dreger & Gros, 2021; Parvathamma, 2020), income loss (Varzakas & Metaxas, 2024; Wang et al., 2022), and wealth, directly influencing demand and consumption (Coibion et al., 2020). As a result, people started to avoid or postpone travel plans (Foo et al., 2021; Immordino et al., 2022; Rutynskyi & Kushniruk, 2020; Singh et al., 2021; Uglis et al., 2022; Uğur & Akbıyık, 2020), leading to a large fall in consumption, particularly in travel.
| Groups | Before | After | Observations in the Model | |
| Control | 52,183 | 39,705 | 91,888 | |
| Treated | 4,285 | 1,505 | 5,790 | |
| Total | 56,468 | 41,210 | 97,678 | |
| Outcome Variables | TE | Std Err. | |t| | P>|t| |
| Before COVID-19 | ||||
| Control (C) | 54.816 (β0) | |||
| Treated (T) | 2,279.131 (β0+ β2) | |||
| Diff (T − C) | 2,224.316 (β2) | 14.358 | 154.92 | .000*** |
| After COVID-19 | ||||
| Control (C) | 59.696 (β0+ β1) | |||
| Treated (T) | 1,536.344 (β0+ β1+ β2+ β3) | |||
| Diff (T − C) | 1,476.648 (β2+ β3) | 23.627 | 62.50 | .000*** |
| Diff-in-diff (DID) | −747.667 (β3) | 27.570 | 27.12 | .000*** |
Notes: R-square: 0.27. Means and standard errors are estimated by linear regression.Inference: ***p < .01; **p < .05; *p < .1.
Previous pandemics like the swine flu, Ebola, SARS, and MERS also demonstrated a significant negative impact on domestic tourism demand by causing a decline in visitor arrivals (Cahyanto et al., 2016; Kuo et al., 2008; Page et al., 2012; Shi & Li, 2017). This ultimately resulted in less tourism spending, as found in our results and supported by many existing studies (Allan et al., 2022; Baños-Pino et al., 2023; Ren et al., 2024; Varzakas & Metaxas, 2024). Again, if some people want to travel cautiously even after the restrictions are loosened, they will shorten their stay to reduce the risk of illness and allocate their daily expenditure to other necessary categories (Baños-Pino et al., 2023). Even people are induced to reduce several consumptions and raise their savings, keeping in mind the future prospects of income and employment, and the government’s ability to resolve these issues due to the uncertain length of the pandemic (Immordino et al., 2022).
| Groups | Before | After | Observations in the Model | |
| Control | 17,614 | 11,712 | 29,326 | |
| Treated | 707 | 206 | 913 | |
| Total | 18,321 | 11,918 | 30,239 | |
| Outcome Variables | TE | Std Err. | |t| | P>|t| |
| Before COVID-19 | ||||
| Control (C) | 19.34 (β0) | |||
| Treated (T) | 1,923.26 (β0+ β2) | |||
| Diff (T − C) | 1,903.92 (β2) | 18.67 | 101.96 | .000*** |
| After COVID-19 | ||||
| Control (C) | 22.78 (β0+ β1) | |||
| Treated (T) | 746.27 (β0+ β1+ β2+ β3) | |||
| Diff (T − C) | 723.49 (β2+ β3) | 34.140 | 21.19 | .000*** |
| Diff-in-diff (DID) | −1,179.43 (β3) | 38.895 | 30.35 | .000*** |
Notes: R-square: 0.27.Means and standard errors are estimated by linear regression.Inference: ***p < .01; **p < .05; *p < .1.
| Groups | Before | After | Observations in the Model | |
| Control | 34,569 | 27,993 | 62,562 | |
| Treated | 3,578 | 1,299 | 4,877 | |
| Total | 38,147 | 29,292 | 67,439 | |
| Outcome Variable | TE | Std Err. | |t| | P>|t| |
| Before COVID-19 | ||||
| Control | −21.02 (β0) | |||
| Treated | 2,275.62 (β0+ β2) | |||
| Diff (T − C) | 2,296.65 (β2) | 18.140 | 126.61 | .000*** |
| After COVID-19 | ||||
| Control | −18.09 (β0+ β1) | |||
| Treated | 1,587.20 (β0+ β1+ β2+ β3) | |||
| Diff (T − C) | 1,605.29 (β2+ β3) | 29.26 | 54.87 | .000*** |
| Diff-in-diff | −691.35 (β3) | 34.37 | 20.11 | .000*** |
Notes: R-square: 0.23. Means and standard errors are estimated by linear regression.Inference: ***p < .01; **p < .05; *p < .1.
Table 5 indicates that location and gender have a negative and insignificant association with tourism expenditure. Few studies found that women are the most vulnerable to the COVID-19 effect, and they also avoid traveling (Cahyanto et al., 2016) due to financial constraints (Sahoo et al., 2022), along with higher contagion risk (Cortes & Forsythe, 2020; Park & Reisinger, 2010; Varshney et al., 2020). But the existing studies of the pre-COVID period indicate that women spend more on tourism in comparison to men (Brida & Scuderi, 2013; Marcussen, 2011; Wang & Davidson, 2010). Out of all age groups, only the grownups dominated (26-60) positively and significantly influenced tourism spending. Wang and Xia (2021) found that older individuals are more likely to travel and spend more money on leisure during this pandemic. But during the pre-COVID period, Dardis et al. (1981) found a negative association between the age group of 15 and 64 and tourism expenditure, as they prefer to spend more on education, health, and children. Few studies show that younger people are more psychologically influenced and avoid traveling (Varshney et al., 2020). Even Cai (1999) and Lee (2001) noted a statistically insignificant relationship between age and tour spending. In the occupation group, only salaried employees (positive) and the miscellaneous group (negative) exhibit significant coefficients. Salaried workers may, with an income certainty, plan for a holiday after the relaxation of the restrictions and positively contribute to tourist spending. In contrast, miscellaneous groups with uncertain jobs and little or no income may seek to store some money for future cautious consumption and may avoid fancy consumption like a vacation. The other two categories—farmers and small traders and daily wage earners—have an insignificant association. Even Brida and Scuderi (2013) stated that occupation as a regressor is sparingly used in applied micro-econometrics determinants of tourism behavior, and the results were mostly insignificant.
Compared to households with highly educated members, those with moderately and least educated members have a significant but negative impact on tourism expenditure. Previous studies have also shown that visitor education is positively correlated with tourist spending, indicating that those with better education tend to travel more due to better-paying jobs (Dardis et al.,1981; Nicolau & Más, 2005; Wu et al., 2013). On the other hand, people with lower levels of education are most affected by reduced hiring rates and higher job losses and pay cuts, which directly impact their spending choices, especially on travel and entertainment (Cortes & Forsythe, 2020). The household size of 6-10 members indicates a positive statistically significant relationship with tourism expenditure. However, the literature suggests that an increase in the number of members leads to stronger contagion fears (Immordino et al., 2022), reducing the likelihood of travel. Our results found that, if the household size exceeds 10, there is a negative and insignificant relationship with tourism expenditure (Fleischer & Rivlin, 2009; Jang & Ham, 2009; Lin et al., 2021). Nevertheless, people may still plan a vacation with all safety precautions for stress relief and to improve mental health, which could positively contribute to tourist consumption.
| Control Variables | Coefficients | P Values |
| Treated (β1) | 2,224.31 | .000*** |
| Time (β2) | 4.89 | .41 |
| Treated × Time (β3) | −747.667 | .000*** |
| Female dominated | −5.489 | .431 |
| Balanced gender | −5.934 | .459 |
| Urban | −10.139 | .172 |
| Grownup dominated | 24.34 | .003** |
| Balanced age | 2.496 | .789 |
| Salaried employees | 70.934 | .000*** |
| Farmers | −2.60 | .808 |
| Small traders and wage earners | 7.23 | .409 |
| Miscellaneous | −37.114 | .001** |
| Moderately educated | −80.201 | .000*** |
| Least educated | −90.478 | .000*** |
| HH size 6–10 members | 37.710 | .000*** |
| HH size >10 | −17.889 | .806 |
| Constant | 33.283 | .013** |
| Observations | 97,678 | – |
| R-squared | 0.2325 | |
| Adj. R-squared | 0.2324 | – |
| Dependent variable: Total_ TEht | ||
| Estimation method: OLS | ||
Notes: ***p < .01; **p < .05; *p < .1.
Reference groups: Male-dominated, rural, young dominated, business personnel, better educated HH, and HH size from one to five.
Table 6 presents an analysis of household control variables and their impact on tourism consumption in rural and urban areas in the presence of COVID-19. The results show that the influence of the pandemic on tour spending is similar to the national level when considering all the variables in the urban area. However, there are some exceptions in the rural region. In rural areas, variables such as balanced gender (positive), small traders and wage earners (negative, insignificant), farmers (significant), and household size of 6-10 members (insignificant) show different tour consumption patterns compared to the urban and national levels. Upon examining different occupation types, it was discovered that the group of farmers has a significant negative impact on tourism spending in rural areas. Even before the pandemic, the financial situation of Indian farmers was precarious due to their low income, with the majority of their income being taken by intermediaries, dealers, and, in some cases, landowners. Unfortunately, due to COVID-19 restrictions, their situation has only worsened.
| Rural | Urban | |||
| Control Variables | Coefficients | P Values | Coefficients | P Values |
| Treated (β1) | 1,903.92 | .000 *** | 2,291.231 | .000*** |
| Time (β2) | 3.42 | .556 | 5.85 | .48 |
| Treated × Time (β3) | −1,180.423 | .000 *** | −693.513 | .000*** |
| Female dominated | −2.01 | .766 | −6.181 | .521 |
| Balanced gender | 6.87 | .386 | −11.235 | .305 |
| Grownup dominated | 12.45 | .096* | 30.942 | .008*** |
| Balanced age | 2.91 | .736 | 3.721 | .78 |
| Salaried employees | 34.67 | .002*** | 74.992 | .000*** |
| Farmers | −18.87 | .038** | −2.488 | .919 |
| Small traders and wage earners | −10.94 | .27 | 10.595 | .364 |
| Miscellaneous | −29.83 | .027** | −43.862 | .002*** |
| Moderately educated | −19.16 | .022** | −95.419 | .000*** |
| Least educated | −29.13 | .000*** | −110.734 | .000*** |
| HH size 6–10 members | 3.667 | .646 | 59.754 | .000*** |
| HH size >10 | −29.70 | .612 | −7.24 | .949 |
| Constant | 19.34 | .139 | 21.482 | .172 |
| Observations | 30,239 | – | 67,439 | – |
| R-squared | 0.2699 | 0.2295 | ||
| Adj. R-squared | 0.2696 | – | 0.2293 | – |
| Dependent variable: TE_Rural (for rural HHs) TE_Urban (for urban HHs). | ||||
| Estimation method: OLS | ||||
Notes: ***p < .01; **p < .05; *p < .1.
Reference groups: Male dominated, young dominated, business personnel, better educated HH, and HH size from one to five.
Robustness Check 1: Two-sample t-test with Equal Variances
We check the robustness of the DID model using a t-test. (Table 7) The result states that the mean of TE for the pre-COVID-19 period was ₹2,243.63, while it declined to ₹1,497.39 in the post-COVID-19 period. So the result rejected the null hypothesis that the TE of both the years are the same (µ1 = µ2) and accepted the alternative hypothesis of µ1 ≠ µ2, that is, it indicates that there is a difference in tourism expenditure of the sample households in India. The t-test results support the DID findings, which show that COVID-19 has a significant negative influence on tourism spending.
| Groups | Observations | Mean | Std Err | SD |
| Control (Pre-COVID-19 Period) | 4,285 | 2,243.63 | 64.20 | 4,202.7 |
| Treatment (post-COVID-19 period) | 1,505 | 1,497.39 | 38.41 | 14,902 |
| All | 5,790 | 2,049.67 | 48.74129 | 3,708.8 |
| Mean difference | – | 746.2359 | 110.7061 | – |
| t-stat = 6.7407*** | ||||
We also check for the robustness of the rural and urban samples. The t-test results suggest a drop in tourism consumption in both rural (₹1,186.20) and urban (₹689.42) areas, which is to be expected given the prevalence of the COVID-19 pandemic and its attendant constraints (lockdown, social distancing, curfew, and travel halt).
Robustness Check 2: PSM
Both control and treated (Table 8) groups include tourism expenditure of the pre- and post- COVID-19 periods, respectively. Here, we used five types of the most commonly used PSM tests, where the results of all the matching algorithms are statistically significant and are parallel to the result of DID analysis as well as the t-test, indicating a negative difference between the control and treated groups. In other words, people spent less during the COVID-19 pandemic period on tourism than they did before the COVID-19 situation.
| Matching Algorithms | MTE of Treated | MTE of Control | Difference | SE | T-stat |
| k-Nearest neighbors matching | 1,497.39 | 2,036.67 | −539.28 | 249.27 | −2.16** |
| Radius matching | 1,497.39 | 2,163.16 | −665.77 | 78.79 | −8.45*** |
| Kernel matching | 1,497.39 | 2,189.28 | −691.89 | 79.85 | −8.66*** |
| Local linear regression matching | 1,497.39 | 2,182.56 | −685.17 | 79.87 | −8.58*** |
| Mahalanobis matching | 1,522.10 | 2,136.82 | −614.72 | 282.84** | −2.17** |
| T-stat: 1.72−1.96*, 1.96−2.18**, > 2.18*** | |||||
Note: MTE: Mean tourism expenditure.
We performed several robustness tests to double-check the results. Specifically, we reestimate the baseline model with a two-sample t-test and PSM. Estimated responses are found to be qualitatively similar to the baseline results. Moreover, we used the PSM test for estimating the tourism spending pattern in rural and urban households in India. This also suggests that the baseline results are qualitatively robust to different estimation settings.
Concluding Observations
In regard to analyzing the impact of the COVID-19 outbreak on tourism-spending behavior in Indian households, our findings indicate a significant decrease in tourism expenditure as a result of the outbreak. The one-way t-test and PSM result also validated the DID results as a robustness check. While the outbreak has affected travel spending in both urban and rural areas, rural travel expenses have been more negatively impacted. During the COVID-19 pandemic, the DID results indicated a 34% decline in tour expenditure compared to the pre-COVID-19 period, with a 30% decrease in urban spending and a significant 62% reduction in rural tour spending. Though we are all aware of the reasons behind it, we should also know that this decline may adversely affect the tourism sector to the highest degree, with overall economic growth, being a source of revenue, employment, and income at the destination as well as for the economy. Moreover, we found that socioeconomic and demographic factors, such as age, education, occupation, and family size, continue to play a significant role in determining the amount of money spent on tourism, regardless of the COVID or pre-COVID situation, while gender appears to be insignificant in the former situation.
The implications of these findings for policymakers in India are significant. The study’s results provide policymakers with an insight into the current state of tourism spending in both rural and urban areas, which can help in formulating adequate policies, including marketing and investment strategies for the quick recovery of the most-affected sectors of the tourism industry. Additionally, the findings may help tourism practitioners gain a clear understanding of the current and future effects of the pandemic on the tour and travel sectors. As domestic tourism is a key driver of destination resilience in countries like India, a reduction in tourism expenditure can also affect related industries, such as transportation, food and beverage, and hotel sectors (Zhou et al., 1997). Therefore, policymakers, tourism practitioners, and governments should pay more attention to the severity of the COVID-19 devastation to ensure the gradual recovery of this sector. Reduced household tourism spending can adversely affect the industry’s growth, reducing revenue and exacerbating unemployment. Economizing tourism packages with appropriate safety measures can be provided to restore the situation. Additionally, the study finds that the COVID-19 outbreak has more negatively impacted the tourism spending of rural households than urban households in India. Thus, policymakers should consider promoting the employment of rural labor in the agriculture sector and creating job opportunities for them in urban areas. While the study’s findings lack generalizability, similar studies could be conducted for other emerging market economies.
The authors declared no potential conflicts of interest with respect to the research, authorship, and/or publication of this article.
The authors received no financial support for the research, authorship, and/or publication of this article.
Rasmita Nayak https://orcid.org/0000-0002-6631-9853
Abdullah M. N. A. (2021). Revenge tourism: Trend or impact post–pandemic Covid–19? In Kusumah A. H. G., Abdullah C. U., Turgarini D., Ruhimat M., Ridwanudin O., & Yuniawati Y. (Eds.), Promoting creative tourism: Current issues in tourism research (pp. 623–627). Routledge.
Alexander D., & Karger E. (2020). Do stay–at–home orders cause people to stay at home? Effects of stay–at–home orders on consumer behavior. The Review of Economics and Statistics, 105(4), 1017–1027.
Allan G., Connolly K., Figus G., & Maurya A. (2022). Economic impacts of COVID–19 on inbound and domestic tourism. Annals of Tourism Research Empirical Insights, 3(2), 100075.
Arbulú I., Razumova M., Rey–Maquieira J., & Sastre F. (2021). Measuring risks and vulnerability of tourism to the COVID–19 crisis in the context of extreme uncertainty: The case of the Balearic Islands. Tourism Management Perspectives, 39, 100857.
Athma P., & Nalini G. (2013). Tourism in India: An analysis. International Journal of Management Prudence, 5(1), 25–35.
Au A. K., Ramasamy B., & Yeung M. C. (2005). The effects of SARS on the Hong Kong tourism industry: An empirical evaluation. Asia Pacific Journal of Tourism Research, 10(1), 85–95.
Bae S. Y., & Chang P. J. (2021). The effect of coronavirus disease–19 (COVID–19) risk perception on behavioural intention towards “untact” tourism in South Korea during the first wave of the pandemic (March 2020). Current Issues in Tourism, 24(7), 1017–1035.
Baker S. R., Farrokhnia R. A., Meyer S., Pagel M., & Yannelis C. (2020). How does household spending respond to an epidemic? Consumption during the 2020 COVID–19 pandemic. The Review of Asset Pricing Studies, 10(4), 834–862.
Banday U. J., & Kocoglu M. (2015). Tourism as a long–run economic growth factor: An empirical investigation for India using causality analysis. World Journal of Islamic History and Civilization, 5(2), 48–53.
Baños–Pino J. F., Boto–García D., Del Valle E., & Sustacha I. (2023). The impact of COVID–19 on tourists’ length of stay and daily expenditures. Tourism Economics, 29(2), 437–459.
Bartik A. W., Bertrand M., Cullen Z. B., Glaeser E. L., Luca M., & Stanton C. T. (2020). How are small businesses adjusting to COVID–19? Early evidence from a survey (No. w26989). National Bureau of Economic Research.
Binder C. (2020). Coronavirus fears and macroeconomic expectations. Review of Economics and Statistics, 102(4), 721–730.
Blake A., Sinclair M. T., & Sugiyarto G. (2003). Quantifying the impact of foot and mouth disease on tourism and the UK economy. Tourism Economics, 9(4), 449–465.
Boto–García D., & Leoni V. (2021). Exposure to COVID–19 and travel intentions: Evidence from Spain. Tourism Economics, 8(6), 1499–1519.
Brida J. G., & Scuderi R. (2013). Determinants of tourist expenditure: A review of microeconometric models. Tourism Management Perspectives, 6, 28–40.
Cahyanto I., Wiblishauser M., Pennington–Gray L., & Schroeder A. (2016). The dynamics of travel avoidance: The case of Ebola in the US. Tourism Management Perspectives, 20, 195–203.
Cai L. A. (1999). Relationship of household characteristics and lodging expenditure on leisure trips. Journal of Hospitality & Leisure Marketing, 6(2), 5–18.
Caliendo M., & Kopeinig S. (2008). Some practical guidance for the implementation of propensity score matching. Journal of Economic Surveys, 22(1), 31–72.
Chen H., Qian W., & Wen Q. (2021). The impact of the COVID–19 pandemic on consumption: Learning from high–frequency transaction data. In AEA Papers and Proceedings, 111, 307–311.
Chronopoulos D. K., Lukas M., & Wilson J. O. (2020). Consumer spending responses to the COVID–19 pandemic: An assessment of Great Britain. http://dx.doi.org/10.2139/ssrn.3586723
Coibion O., Gorodnichenko Y., & Weber M. (2020). The cost of the COVID–19 crisis: Lockdowns, macroeconomic expectations, and consumer spending (No. w27141). National Bureau of Economic Research.
Cooper M. (2006). Japanese tourism and the SARS epidemic of 2003. Journal of Travel &Tourism Marketing, 19(2–3), 117–131.
Cortes G. M., & Forsythe E. (2020). The heterogeneous labor market impacts of the COVID–19 pandemic. http://dx.doi.org/10.2139/ssrn.3634715
Cox N., Ganong P., Noel P., Vavra J., Wong A., Farrell D., Greig F., & Deadman E. (2020). Initial impacts of the pandemic on consumer behavior: Evidence from linked income, spending, and savings data. Brookings Papers on Economic Activity, 2020(2), 35–82.
Cretu C. M., Turtureanu A. G., Sirbu C. G., Chitu F., Marinescu E. ?., Talaghir L. G., & Robu D. M. (2021). Tourists’ perceptions regarding traveling for recreational or leisure purposes in times of health crisis. Sustainability, 13(15), 8405.
Dardis R., Derrick F., Lehfeld A., & Wolfe K. E. (1981). Cross–section studies of recreation expenditures in the United States. Journal of Leisure Research, 13(3), 181–194.
Dombey O. (2004). The effects of SARS on the Chinese tourism industry. Journal of Vacation Marketing, 10(1), 4–10.
Dreger C., & Gros D. (2021). Lockdowns and the US unemployment crisis. Economics of Disasters and Climate Change, 5(3), 449–463.
Dritsakis N. (2004). Tourism as a long–run economic growth factor: An empirical investigation for Greece using causality analysis. Tourism Economics, 10(3), 305–316.
Dwyer L., Forsyth P., & Spurr R. (2004). Evaluating tourism’s economic effects: New and old approaches. Tourism Management, 25(3), 307–317.
Eugenio–Martin J. L., Martín Morales N., & Scarpa R. (2004). Tourism and economic growth in Latin American countries: A panel data approach (Working Paper No. 26.2004). Fondazione Eni Enrico Mattei (FEEM).
Fleischer A., & Rivlin J. (2009). More or better? Quantity and quality issues in tourism consumption. Journal of Travel Research, 47(3), 285–294.
Foo L. P., Chin M. Y., Tan K. L., & Phuah K. T. (2021). The impact of COVID–19 on tourism industry in Malaysia. Current Issues in Tourism, 24(19), 2735–2739.
Fredriksson A., & Oliveira G. M. D. (2019). Impact evaluation using difference–in–differences. RAUSP Management Journal, 54, 519–532.
Girish V. G. (2021). COVID–19 pandemic and the emergence of revenge travel. International Journal of Tourism and Hospitality Research, 35(10), 125–129.
Guerra A., Pattitoni P., & Vici L. (2024). The impact of COVID–19 on tourism expenditures: A quasi–DiD analysis. Tourism Economics, 30(8), 2134–2158.
Günay F., Bayraktaro?lu E., & Özkul K. (2020). Assessing the short–term impacts of COVID–19 pandemic on foreign visitor’s demand for Turkey: A scenario analysis. Journal of Ekonomi, 2(2), 80–85.
Gupta M., & Kishore A. (2021). Unemployment and household spending in rural and urban India: Evidence from panel data. The Journal of Development Studies, 58(3), 545–560.
Haque T. H., & Haque M. O. (2018). The swine flu and its impacts on tourism in Brunei. Journal of Hospitality and Tourism Management, 36, 92–101.
Haryanto T. (2020). COVID–19 pandemic and international tourism demand. JDE (Journal of Developing Economies), 5(1), 1–5.
Immordino G., Jappelli T., Oliviero T., & Zazzaro A. (2022). Fear of COVID?19 contagion and consumption: Evidence from a survey of Italian households. Health Economics, 31(3), 496–507.
Inchausti–Sintes F. (2015). Tourism: Economic growth, employment and Dutch disease. Annals of Tourism Research, 54, 172–189.
Ivanova M., Ivanov I. K., & Ivanov S. (2021). Travel behaviour after the pandemic: The case of Bulgaria. Anatolia, 32(1), 1–11.
Jang S. S., & Ham S. (2009). A double–hurdle analysis of travel expenditure: Baby boomer seniors versus older seniors. Tourism Management, 30(3), 372–380.
Joo H., Maskery B. A., Berro A. D., Rotz L. D., Lee Y. K., & Brown C. M. (2019). Economic impact of the 2015 MERS outbreak on the Republic of Korea’s tourism–related industries. Health Security, 17(2), 100–108.
Karl M., Kock F., Ritchie B. W., & Gauss J. (2021). Affective forecasting and travel decision–making: An investigation in times of a pandemic. Annals of Tourism Research, 87, 103139.
Khan H., Seng C. F., & Cheong W. K. (1990). Tourism multiplier effects on Singapore. Annals of Tourism Research, 17(3), 408–418.
Kim S. J. (2017). A study on the effect of MERS on the management performance of tourism industry. The Journal of the Korea Contents Association, 17(11), 515–524.
Kock F., Nørfelt A., Josiassen A., Assaf A. G., & Tsionas M. G. (2020). Understanding the COVID–19 tourist psyche: The evolutionary tourism paradigm. Annals of Tourism Research, 85, 103053.
Kukanja M., Planinc T., & Sikošek M. (2020). Crisis management practices in tourism SMEs during the COVID–19 pandemic. Organizacija, 53(4), 346–361.
Kuo H. I., Chen C. C., Tseng W. C., Ju L. F., & Huang B. W. (2008). Assessing impacts of SARS and Avian Flu on international tourism demand to Asia. Tourism Management, 29(5), 917–928.
Lee C. C., & Chang C. P. (2008). Tourism development and economic growth: A closer look at panels. Tourism Management, 29(1), 180–192.
Lee H. C. (2001). Determinants of recreational boater expenditures on trips. Tourism Management, 22(6), 659–667.
Li J., Nguyen T. H. H., & Coca–Stefaniak J. A. (2020). Coronavirus impacts on post–pandemic planned travel behaviours. Annals of Tourism Research, 86, 102964.
Lin V. S., Qin Y., Li G., & Wu J. (2021). Determinants of Chinese households’ tourism consumption: Evidence from China Family Panel Studies. International Journal of Tourism Research, 23(4), 542–554.
Maphanga P. M., & Henama U. S. (2019). The tourism impact of Ebola in Africa: Lessons on crisis management. African Journal of Hospitality, Tourism and Leisure, 8(3), 1–13.
Marcussen C. H. (2011). Determinants of tourist spending in cross–sectional studies and at Danish destinations. Tourism Economics, 17(4), 833–855.
Mariolis T., Rodousakis N., & Soklis G. (2021). The COVID–19 multiplier effects of tourism on the Greek economy. Tourism Economics, 27(8), 1848–1855.
Martin A., Markhvida M., Hallegatte S., & Walsh B. (2020). Socio–economic impacts of COVID–19 on household consumption and poverty. Economics of Disasters and Climate Change, 4(3), 453–479.
McKercher B., & Chon K. (2004). The over–reaction to SARS and the collapse of Asian tourism. Annals of Tourism Research, 31(3), 716.
Miao L., Im J., Fu X., Kim H., & Zhang Y. E. (2021). Proximal and distal post–COVID travel behavior. Annals of Tourism Research, 88, 103159.
Nayak R., Sahoo B. K., & Mahalik M. K. (2022). Does domestic visitors’ tourism expenditure intensify impoverishment in India? World Development Sustainability, 100009.
Neuburger L., & Egger R. (2021). Travel risk perception and travel behaviour during the COVID–19 pandemic 2020: A case study of the DACH region. Current Issues in Tourism, 24(7), 1003–1016.
Nicolau J. L., & Más F. J. (2005). Stochastic modeling: A three–stage tourist choice process. Annals of Tourism Research, 32(1), 49–69.
Novelli M., Burgess L. G., Jones A., & Ritchie B. W. (2018). “No Ebola … still doomed”: The Ebola–induced tourism crisis. Annals of Tourism Research, 70, 76–87.
Nyarko Y., Goldfrank L., Ogedegbe G., Soghoian S., & Aikins A. D. G. (2015). Preparing for Ebola virus disease in West African countries not yet affected: Perspectives from Ghanaian health professionals. Globalization and Health, 11(1), 1–6.
Ohlan R. (2017). The relationship between tourism, financial development, and economic growth in India. Future Business Journal, 3(1), 9–22.
Page S., Song H., & Wu D. C. (2012). Assessing the impacts of the global economic crisis and swine flu on inbound tourism demand in the United Kingdom. Journal of Travel Research, 51(2), 142–153.
Park K., & Reisinger Y. (2010). Differences in the perceived influence of natural disasters and travel risk on international travel. Tourism Geographies, 12(1), 1–24.
Parvathamma G. L. (2020). Unemployment dimensions of COVID–19 and government response in India: An analytical study. International Journal of Health and Economic Development, 6(2), 28–35.
PIB. (2020). Update on novel coronavirus: one positive case reported in Kerala. https://pib.gov.in/pressreleaseiframepage.aspx?prid=1601095
Ren M., Xu Y., Park S., Huang X., Sun M., Xia J., & Koh S. Y. (2024). Consumer spending during COVID–19 in a tourism city. Annals of Tourism Research, 109, 103830.
Rosselló J., Santana–Gallego M., & Awan W. (2017). Infectious disease risk and international tourism demand. Health Policy and Planning, 32(4), 538–548.
Rubin D. B. (1980). Randomization analysis of experimental data: The Fisher randomization test comment. Journal of the American Statistical Association, 75(371), 591–593.
Rutynskyi M., & Kushniruk H. (2020). The impact of quarantine due to COVID–19 pandemic on the tourism industry in Lviv (Ukraine). Problems and Perspectives in Management, 18(2), 194.
Sahoo B. K., Nayak R., & Mahalik M. K. (2022). Factors affecting domestic tourism spending in India. Annals of Tourism Research Empirical Insights, 3(2), 100050.
Shao Y., Hu Z., Luo M., Huo T., & Zhao Q. (2021). What is the policy focus for tourism recovery after the outbreak of COVID–19? A co–word analysis. Current Issues in Tourism, 24(7), 899–904.
Shi W., & Li K. X. (2017). Impact of unexpected events on inbound tourism demand modeling: Evidence of Middle East respiratory syndrome outbreak in South Korea. Asia Pacific Journal of Tourism Research, 22(3), 344–356.
Shretta R. (2020). The economic impact of COVID–19. Centre for Tropical Medicine and Global Health, Nuffield Department of Medicine, University of Oxford. https://www.tropicalmedicine.ox.ac.uk/news/the–economic–impact–of–COVID–19
Sifolo N., & Sifolo P. P. S. (2015). The tourism inconvenience of the Ebola epidemic: Lessons for the South African tourism sector. African Journal of Hospitality, Tourism and Leisure, 4(1), 1–11.
Singh A. L., Jamal S., & Ahmad W. S. (2021). Impact assessment of lockdown amid covid–19 pandemic on tourism industry of Kashmir Valley, India. Research in Globalization, 3, 100053.
Singh V., Gupta K., & Chakrabarty N. (2020). Psychological impacts on the travel behavior post–COVID–19. Indian Institute of Technology Roorkee.
Škare M., Soriano D. R., & Porada–Rocho? M. (2021). Impact of COVID–19 on the travel and tourism industry. Technological Forecasting and Social Change, 163, 120469.
Tang C. F., & Abosedra S. (2016). Tourism and growth in Lebanon: New evidence from bootstrap simulation and rolling causality approaches. Empirical Economics, 50(2), 679–696.
Uglis J., J?czmyk A., Zawadka J., Wojcieszak–Zbierska M. M., & Pszczo?a M. (2022). Impact of the COVID–19 pandemic on tourist plans: A case study from Poland. Current Issues in Tourism, 25(3), 405–420.
U?ur N. G., & Akb?y?k A. (2020). Impacts of COVID–19 on global tourism industry: A cross–regional comparison. Tourism Management Perspectives, 36, 100744.
UNWTO. (2021). World tourism barometer and statistical annex. World Tourism Barometer, 19(1). https://www.e–unwto.org/doi/epdf/10.18111/wtobarometereng.2021.19.1.1
Varshney M., Parel J. T., Raizada N., & Sarin S. K. (2020). Initial psychological impact of COVID–19 and its correlates in Indian community: An online (FEEL–COVID) survey. PloS One, 15(5), e0233874.
Varzakas I. P., & Metaxas T. (2024). Pandemic and economy: An econometric analysis investigating the impact of COVID–19 on the global tourism market. Tourism and Hospitality, 5(2), 290–303.
Villa J. M. (2012). Simplifying the estimation of difference in differences treatment effects with Stata. https://mpra.ub.uni–muenchen.de/43943
Waldfogel J. (1999). The impact of the Family and Medical Leave Act. Journal of Policy Analysis and Management, 18(2), 281–302.
Wang C., Meng X., Siriwardana M., & Pham T. (2022). The impact of COVID–19 on the Chinese tourism industry. Tourism Economics, 28(1), 131–152.
Wang J., & Xia L. (2021). Revenge travel: Nostalgia and desire for leisure travel post COVID–19. Journal of Travel & Tourism Marketing, 38(9), 935–955.
Wang Y., & Davidson M. C. (2010). A review of micro–analyses of tourist expenditure. Current Issues in Tourism, 13(6), 507–524.
Wen J., Kozak M., Yang S., & Liu F. (2020). COVID–19: Potential effects on Chinese citizens’ lifestyle and travel. Tourism Review, 76(1), 74–87.
Williams A., & Baláž V. (2015). Tourism risk and uncertainty: Theoretical reflections. Journal of Travel Research, 54(3), 271–287.
WTTC. (2021a). Global economic impact and trends 2021. https://wttc.org/Portals/0/Documents/Reports/2021/Global%20Economic%20Impact%20and%20Trends%202021.pdf?ver=2021–07–01–114957–177
WTTC. (2021b). Global economic impact and trends 2021, India. https://wttc.org/Research/Economic–Impact
Wu L., Zhang J., & Fujiwara A. (2013). Tourism participation and expenditure behaviour: Analysis using a scobit based discrete–continuous choice model. Annals of Tourism Research, 40, 1–17.
Zhou D., Yanagida J. F., Chakravorty U., & Leung P. S. (1997). Estimating economic impacts from tourism. Annals of Tourism Research, 24(1), 76–89.
