
Nirma University Journal of Business and Management Studies


Rupam Deb1
1Institute of Management, Nirma University, Ahmedabad, Gujarat, India

This article is distributed under the terms of the Creative Commons Attribution-NonCommercial 4.0 License (https://creativecommons.org/licenses/by-nc/4.0/) which permits non-commercial use, reproduction and distribution of the work without further permission provided the original work is attributed as specified on the SAGE and Open Access page (https://us.sagepub.com/en-us/nam/open-access-at-sage).
Adventure tourism is recognized as a source of regional development and livelihood for local communities. The North East Region of India possesses immense potential for adventure tourism, but a lacuna exists between its potential and actual strategic realization. This study fills this gap by applying a hybrid multi-criteria decision-making technique by integrating the Strengths, Weaknesses, Opportunities, and Threats (SWOT) analysis and the Analytic Hierarchy Process (AHP). The results indicate that the most important strength in the internal environment is the “government pro-tourism approach,” while the main institutional bottleneck is “poor infrastructure.” Under the external environment, the top opportunity is “strong partnership with local communities,” while the biggest external threat to tourist arrivals is “security threats/perceptions.”
Adventure tourism, SWOT, Analytic Hierarchy Process, strategy matrix, regional development
Introduction
Adventure tourism has become a major niche in the tourism industry. Adventurous activities are on the rise due to the demand for active living and overall physical well-being (Hanna et al., 2019; Mackenzie & Brymer, 2020). Adventure tourism is also popularly known for its mental and psychological well-being (Sahoo et al., 2026). The rise in demand leads to the commercialization of these adventurous activities, developing the region’s infrastructure and economic potential. Many countries are leveraging their adventure tourism potential due to its ecological, economic, and cultural values (Mawarni et al., 2022). The adventure tourism market is globally valued at $869.06bn and is expected to grow further in subsequent years (Fortune Business Insights, 2026).
In recent times, the COVID-19 pandemic had a widespread negative impact on many industries (Torabi et al., 2023). Tourism development strategies helped countries to recover post-pandemic. Overall, tourism helps developing regions by improving public facilities (Sirakaya et al., 2002). Adventure tourism promises a bright future for the North East Region (NER) of India with such a diverse geography. NER of India includes eight states, namely, Arunachal Pradesh, Assam, Manipur, Meghalaya, Mizoram, Nagaland, Sikkim, and Tripura. The NER states are endowed with stunning natural scenery, unique history, and cultural and ethnic heritage. All of this provides the region with enormous tourism potential. Due to these diverse attributes, the NER of India has the potential to become the adventure tourism hotspot of the country (ET TravelWorld, 2021). Although the region is blessed with diverse attributes, it also has several limitations concerning adventure tourism in the region. Identifying the various aspects of adventure tourism in the region will help in highlighting the various opportunities and challenges.
Strategic plan development by evaluating the current situation of a particular brand, service, or industry is crucial. Policymakers require a structured, multi-dimensional strategic planning framework. Evaluation of the current state helps develop plans for future approaches, and the Strengths, Weaknesses, Opportunities, and Threats (SWOT) analysis is commonly used to access current state (Taleai et al., 2009). Traditional SWOT analyses are widely utilized in tourism research to map regional operating environments (Reihanian et al., 2012). A SWOT analysis shows the internal strengths, weaknesses, and external areas of opportunities and threats that an industry faces. When implemented correctly, SWOT analysis can serve as a solid foundation for effective policy development.
However, standard SWOT frameworks are frequently critiqued for being purely qualitative, resulting in a descriptive narrative that fails to measure the relative importance or priority of the identified factors (Solangi et al., 2019). To further strengthen our analysis, we have combined the traditional SWOT analysis with the Analytic Hierarchy Process (AHP) technique, which helps in quantifying the different SWOT factors. The AHP method determines the relative significance of different factors within the group (Strength group, Weakness group, Opportunity group, and Threat group) and between the SWOT groups. By applying pairwise comparison matrices to the SWOT factors, the hybrid SWOT-AHP approach systematically quantifies and prioritizes subjective variables (Solangi et al., 2019). This methodology effectively transforms qualitative regional insights into a prioritized hierarchy of actionable strategies. Thus, this study utilizes the hybrid SWOT-AHP framework to evaluate, weight, and rank strategic interventions, providing an empirical roadmap for promoting sustainable adventure tourism across the NER of India.
Objectives:
To identify the internal strengths and weaknesses, and external opportunities and threats.
To apply AHP pairwise comparison matrix to determine the most important factors.
To identify important strategies for adventure tourism development in the region.
Background Review
It is widely evident that adventure tourism serves as a vital catalyst for regional development, particularly within peripheral or ecologically unique destinations. Because adventure tourism activities typically require highly specific environmental and topographical frameworks, they are predominantly viable within, and suited for, remote regions. Earlier research has demonstrated that adventure tourism has successfully fostered growth across various geographies, including mountainous regions (Maroudas et al., 2004), rural areas (Baldacchino et al., 2015), coastal environments (Otieno et al., 2025), and protected forest zones (Buckley, 2000). Beyond macroeconomic growth, these activities serve an essential socio-economic function by acting as a sustainable source of livelihood and community-based empowerment for local populations (Knowles, 2019).
The NER of India is uniquely blessed with diverse terrains and rich natural endowments that offer immense potential for establishing a premier adventure tourism hub. Featuring rugged mountain ranges, dense tropical forests, expansive river systems, and biodiversity-rich national parks, the region possesses the ideal environmental attributes required for specialized adventure tourism development (De, 2013). In recent years, national and regional policy frameworks, such as India’s “Act East” policy, have increasingly emphasized the economic potential of the NER through tourism. However, the execution of sustainable adventure tourism across the region remains a complex challenge. Developing these initiatives requires balancing delicate ecological zones with infrastructure expansion, managing community inclusion, and navigating logistical constraints.
Methodology and Approach
Strengths, Weaknesses, Opportunities, and Threats
Strategic planning involves a thorough examination of both the inner and outer environments. Environmental aspects that an industry controls internally are typically categorized as strengths (S) or weaknesses (W), whereas external factors are categorized as opportunities (O) or threats (T). SWOT analysis has been increasingly used to make strategic decisions about various products and services.
Analytic Hierarchy Process
Although SWOT analysis is a significant tool in strategic decision-making, it lacks the ability to quantify and rank the most important factors. To counter this limitation, we combined the SWOT analysis with the AHP. The AHP is one of the multicriteria decision-making techniques that enables decision-makers to rank each element in terms of relative importance using pairwise comparisons.
For pairwise comparison and assigning relative weights to the SWOT factors, we used the scale developed by Saaty (1980), as shown in Table 1.
| Scale | Meaning |
| 1 | The two factors are equally preferred |
| 3 | Small preference for one factor over another |
| 5 | Strong preference for one factor over another |
| 7 | Strong preference for one factor and its dominance is evident over another |
| 9 | The highest possible order of importance of one factor over another |
| 2, 4, 6, 8 | Used to denote a compromise between the preceding priority |
Source: Satty (2008).
The three guiding steps of the AHP technique are: (a) developing a model structure; (b) pairwise comparison of the criteria and/or subcriteria; and (c) synthesizing the priorities. AHP first creates a hierarchy of interconnected decision components (criteria, subcriteria) from a complex multicriteria decision-making problem. The AHP structure consists of the main objectives, criteria, and subcriteria organized hierarchically in the form of a family tree.
After the problem has been broken down and a hierarchy has been created, the process of pairwise comparison and prioritizing the criteria and subcriteria begins in order to establish their relative weights. The comparison is done using the scale developed by Saaty (2008).
A pairwise matrix A for n criteria can be plotted as an (n ´ n) matrix, where each element aij(i, j = 1, 2,…, n) is the fractional weight of the criteria, as shown in Equation (1). Each input sheet’s priorities are determined using the row geometric mean approach (RGMM).
The next step is to normalize each matrix element to find its relative weight. The right eigenvector (W), which corresponds to the largest eigenvalue (λmax), provides the normalized relative weights.
According to Saaty (1977), if λmax = n, it is sufficient to establish consistency. An inconsistent result may occur when λmax differs from n due to inconsistent responses. An index named the consistency index (CI) has been developed to determine whether the matrix A is consistent (Equation (3)) (Saaty, 1980).
Lastly, the consistency ratio (CR) is used to determine the final consistency. The CR is calculated by dividing the CI by the random index (RI), as shown in Equation (4). RI table (Table 2) is used to obtain the value of RI (Saaty & Vargas, 1991).
| Size of matrix (n) | 1 | 2 | 3 | 4 | 5 | 6 | 7 | 8 | 9 | 10 |
| Random Index (RI) | 0 | 0 | 0.52 | 0.89 | 1.11 | 1.25 | 1.35 | 1.4 | 1.45 | 1.49 |
Source: Saaty and Vargas (1991).
The accepted upper limit for CR is set at 0.1. If the final CR is higher than this amount, then all or some of the pairwise comparisons must be repeated to enhance consistency.
The main objective of the study is to evaluate the current state of adventure tourism in the NER of India. We first identified its SWOT, as shown in Figure 1. Secondary sources such as previous literature, industry indicators, and articles were used to identify the various SWOT criteria and subcriteria.
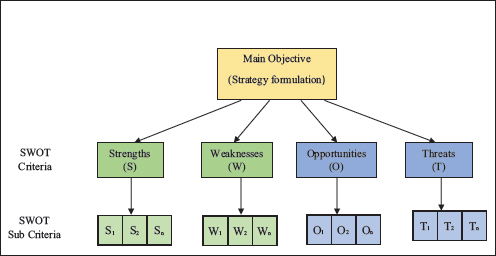
In this study, responses were collected from stakeholders such as adventure tourists, residents of the region, private tour operators, and tourism scholars. The responses were collected using the Saaty (1980) scale. The study employs a SWOT-AHP analysis, in which the AHP is used to identify and prioritize the stakeholders’ responses using a pairwise comparison concerning the SWOT criteria and subcriteria. Finally, according to the results, strategies for developing adventure tourism in the NER are established.
The steps of the research methodology for the purpose of this study are given below:
Step 1: Problem identification.
Step 2: Research method selection. For this study, we will be using the SWOT-AHP analysis.
Step 3: Determining initial SWOT factors.
Step 4: Determination of stakeholder groups—adventure tourists, residents of the region, private tour operators, and tourism scholars.
Step 5: Verification of SWOT factors—separation of factors through SWOT subcriteria according to stakeholders’ opinions.
Step 6: Data collection—obtaining responses from the stakeholders based on Saaty’s scale.
Step 7: SWOT-AHP analysis—creating an analytical hierarchy model, developing a pairwise comparison matrix, matrix normalization, and criteria weight calculation.
Step 8: Consistency test.
Step 9: Development of strategies based on priority criteria.
Results and Findings
The comparison results of the SWOT group are shown in Table 3. According to our analysis, we found that the Opportunities group has the highest priority, that is, 0.440.
| SWOT Group | S | W | O | T | Priority of SWOT Group |
| Strength (S) | 1 | 0.584 | 0.504 | 1.505 | 0.188 |
| Weaknesses (W) | 1.712 | 1 | 0.452 | 0.828 | 0.209 |
| Opportunities (O) | 1.984 | 2.212 | 1 | 3.337 | 0.440 |
| Threats (T) | 0.664 | 1.208 | 0.300 | 1 | 0.163 |
| Consistency ratio (CR) = 0.049 |
The comparison results of Strength subfactors are shown in Table 4. According to our analysis, we found that S3 has the highest priority, that is, 0.390.
| Strengths | S1 | S2 | S3 | S4 | Priority of Strength Subfactor |
| (S1) North East Region (NER) is full of rich natural resources and cultural diversity | 1 | 2.667 | 0.381 | 0.708 | 0.229 |
| (S2) Clean and pollution-free environmentideal for adventurers | 0.375 | 1 | 0.566 | 1.102 | 0.167 |
| (S3) Government pro-tourism approach | 2.627 | 1.768 | 1 | 1.744 | 0.390 |
| (S4) Suitable terrain for various adventureactivities | 1.412 | 0.908 | 0.574 | 1 | 0.214 |
| Consistency ratio (CR) = 0.094 |
The comparison results of Weakness subfactors are shown in Table 5. According to our analysis, we found that W4 has the highest priority, that is, 0.390.
| Weaknesses | W1 | W2 | W3 | W4 | W5 | W6 | Priority of Weakness Subfactor |
| (W1) Ruling of unorganized tour operators | 1 | 0.467 | 0.35 | 0.673 | 0.899 | 0.676 | 0.103 |
| (W2) Low accessibility | 2.141 | 1 | 1.219 | 0.545 | 1.032 | 0.764 | 0.158 |
| (W3) Lack of trained personnel and institutes | 2.857 | 0.820 | 1 | 0.435 | 1.486 | 1.247 | 0.174 |
| (W4) Poor infrastructure | 1.486 | 1.835 | 2.299 | 1 | 3.061 | 2.87 | 0.307 |
| (W5) Accommodation issues | 1.112 | 0.969 | 0.673 | 0.327 | 1 | 0.807 | 0.115 |
| (W6) Low foreign tourist | 1.479 | 1.309 | 0.802 | 0.348 | 1.239 | 1 | 0.143 |
| Consistency ratio (CR) = 0.037 |
The comparison results of Opportunity subfactors are shown in Table 6. According to our analysis, we found that O3 has the highest priority, that is, 0.347.
| Opportunity | O1 | O2 | O3 | O4 | Priority of Opportunity Subfactor |
| (O1) Promoting homestays as a sustainable source of livelihood for locals | 1 | 1.626 | 0.552 | 0.599 | 0.213 |
| (O2) Development of other related industries (hospitality, travel and handicraft) | 0.615 | 1 | 0.763 | 1.06 | 0.206 |
| (O3) Strong partnership with the local communities | 1.812 | 1.311 | 1 | 1.842 | 0.347 |
| (O4) Expand adventure market by attracting foreigntourist | 1.669 | 0.943 | 0.543 | 1 | 0.235 |
| Consistency ratio (CR) = 0.050 |
The comparison results of Threat subfactors are shown in Table 7. According to our analysis, we found that T2 has the highest priority, that is, 0.440.
| Threats | T1 | T2 | T3 | T4 | Priority of Threat Subfactor |
| (T1) Uncertain weather conditions | 1 | 0.343 | 0.807 | 0.869 | 0.160 |
| (T2) Security threats/perceptions | 2.918 | 1 | 1.723 | 2.758 | 0.440 |
| (T3) Instability in the region affects tourist inflows | 1.239 | 0.581 | 1 | 1.601 | 0.237 |
| (T4) Competition from other states and neighboring countries | 1.151 | 0.363 | 0.625 | 1 | 0.163 |
| Consistency ratio (CR) = 0.006 |
The overall priority score is shown in Table 8. It indicates that strong partnership with the local communities is the most important factor.
| SWOT Group | Group Priority | SWOT Subcriteria | Priority of Subcriteria | Overall Priority |
| (S1) | 0.229 | 0.0430 | ||
| Strengths | 0.188 | (S2) | 0.167 | 0.0313 |
| (S3) | 0.390 | 0.0733 | ||
| (S4) | 0.214 | 0.0403 | ||
| (W1) | 0.103 | 0.0216 | ||
| (W2) | 0.158 | 0.0331 | ||
| Weaknesses | 0.209 | (W3) | 0.174 | 0.0363 |
| (W4) | 0.307 | 0.0641 | ||
| (W5) | 0.115 | 0.0240 | ||
| (W6) | 0.143 | 0.0299 | ||
| (O1) | 0.213 | 0.0935 | ||
| Opportunities | 0.44 | (O2) | 0.206 | 0.0904 |
| (O3) | 0.347 | 0.1526 | ||
| (O4) | 0.235 | 0.1034 | ||
| (T1) | 0.160 | 0.0261 | ||
| Threats | 0.163 | (T2) | 0.440 | 0.0716 |
| (T3) | 0.237 | 0.0386 | ||
| (T4) | 0.163 | 0.0266 |
Note: The bold text represents the highest priority. Keep it as it is.
Conclusion
By fusing SWOT and AHP methodologies, we have identified critical strategic determinants for the NER adventure tourism industry in this article. According to the findings, each SWOT group’s priority is ranked as follows: Threats (16.27%), Weaknesses (20.93%), Opportunities (44.01%), and Strengths (18.80%). The analysis finds that “strong partnership with the local communities” from the opportunities group is the most crucial SWOT component. With a total priority value of 34.7%, this issue is the most crucial one to take into account. Other important variables are: Government pro-tourism approach (14.7%) from the Strength group, security threats/perceptions from the Threat group (4.3%), and poor infrastructure (4.3%) from the Weakness group.
It is possible to design a management strategy or receive support for important decisions using the calculated priorities of SWOT criteria (Gottfried et al., 2018). Additionally, a collection of suitable strategy alternatives for adventure tourism policies can be created using the findings of this study. Future studies may enhance the use of the AHP method with the fuzzy logic framework to more effectively examine scenarios with uncertainty.
Strategic Implications
Based on the results obtained from the hybrid SWOT-AHP analysis, four distinct sets of strategic measures can be formulated to guide adventure tourism development in NER. These strategic choices are categorized based on the interaction between internal capabilities and external market dynamics: offensive strategies (SO: combining strengths and opportunities), defensive strategies (ST: combining strengths and threats), adaptive strategies (WO: combining weaknesses and opportunities), and survival strategies (WT: combining weaknesses and threats) (Díaz-López et al., 2020). The policy-strategy matrix is depicted in Table 9.
| Policy for adventure tourism development in NER | Internal strengths (S) | Internal weaknesses (W) |
| (S1) NER is full of rich natural resources and cultural diversity | (W1) Ruling of unorganized tour operators | |
| External opportunities (O) | Strategy 1 | Strategy 2 |
| (O1) Promoting homestays as a sustainable source of livelihood for locals | Community-led policy optimization | Public-private-community infrastructure development |
| External threats (T) | Strategy 3 | Strategy 4 |
| (T1) Uncertain weather conditions | Institutionalizing perception and safety upgrades | Risk-mitigating infrastructure and community governance |
Offensive Strategy: Community-led Policy Optimization
This strategy is obtained by combining: government pro-tourism approach (S3) + strong partnership with the local communities (O3). This strategy utilizes a strong government push to formalize and scale grassroots community partnerships with the locals. By integrating the government’s pro-tourism policies with local communities, policymakers can institutionalize community-based adventure tourism networks. This includes establishing government-backed financial support and incentive models, cooperative legal advisory structures for local entrepreneurs, and training programs that empower indigenous populations to manage homestays and guide operations safely, turning state policies into a localized economic growth engine.
Adaptive Strategy: Public-Private-Community Infrastructure Development
This strategy is obtained by combining poor infrastructure (W4) + strong partnership with the local communities (O3). This strategy uses community resources and local coordination as an asset to attract public and private investment to tackle critical connectivity and logistical problems. Rather than waiting for massive capital infrastructure renovations, immediate, low-impact adventure tourism infrastructure (i.e., standard campsites, eco-lodges, directional trail markers, and localized rescue points) can be co-developed with local communities. This distributive and decentralized model will expedite the infrastructure development process, keeping ownership with the locals.
Defensive Strategy: Institutionalizing Perception and Safety Upgrades
This strategy is obtained by combining government pro-tourism approach (S3) + security threats/perceptions (T2). In this strategy, the administrative authority of the government and local authorities should be utilized to break down the long-standing negative security perceptions of the NER. The approach involves the government pushing for specialized and visible infrastructure development, such as dedicated tourist police centers, centralized real-time travel advisory portals, and standardized security certifications for adventure tour operators. State machinery institutionalizing safety policies and committing the same can transform an active external barrier into a state-regulated, low-risk operating environment.
Survival Strategy: Risk-mitigating Infrastructure and Community Governance
This strategy is obtained by combining: poor infrastructure (W4) + security threats/perceptions (T2). In this strategy, the key idea is to activate the risk-reduction mechanism, which stresses the protection and stabilization of fragile tourist routes. Development should be restricted to well-defined, secure clusters in areas lacking infrastructure and where perceptions of security are weak. This includes building decentralized emergency communication systems and developing community-based tourist monitoring and safety networks. The region has structural limitations but can still be a safe place for adventure activities by empowering, educating, and guiding the local communities to be the main guardians of security and emergency response in the region.
The author declared no potential conflicts of interest with respect to the research, authorship, and/or publication of this article.
The author received no financial support for the research, authorship, and/or publication of this article.
Rupam Deb https://orcid.org/0000-0002-8209-2935
Baldacchino G., Helgadóttir G., & Mykletun R. J. (2015). Rural tourism: Insights from the North Atlantic. Scandinavian Journal of Hospitality and Tourism, 15(1–2), 1–7. https://doi.org/10.1080/15022250.2015.1020124
Buckley R. (2000). Neat trends: Current issues in nature, eco–and adventure tourism. International Journal of Tourism Research, 2(6), 437–444. https://doi.org/10.1002/1522–1970(200011/12)2:6%3C437::AID–JTR245%3E3.0.CO;2–#
De U. K. (2013). Sustainable nature–based tourism, involvement of Indigenous women and development: A case of North–East India. Tourism Recreation Research, 38(3), 311–324. https://doi.org/10.1080/02508281.2013.11081756
Díaz–López C., Carpio M., Martín–Morales M., & Zamorano M. (2020). Defining strategies to adopt Level(s) for bringing buildings into the circular economy. A case study of Spain. Journal of Cleaner Production, 287, 125048. https://doi.org/10.1016/j.jclepro.2020.125048
ET TravelWorld. (2021, November 30). Northeast has potential to become adventure tourism capital of India: ATOAI. https://travel.economictimes.indiatimes.com/news/destination/states/northeast–has–potential–to–become–adventure–tourism–capital–of–india–atoai/88003871
Fortune Business Insights. (2026). Adventure tourism market size & future outlook. https://www.fortunebusinessinsights.com/adventure–tourism–market–107924
Gottfried O., De Clercq D., Blair E., Weng X., & Wang C. (2018). SWOT–AHP–TOWS analysis of private investment behavior in the Chinese biogas sector. Journal of Cleaner Production, 184, 632–647. https://doi.org/10.1016/j.jclepro.2018.02.173
Hanna P., Wijesinghe S., Paliatsos I., Walker C., Adams M., & Kimbu A. (2019). Active engagement with nature: Outdoor adventure tourism, sustainability and wellbeing. Journal of Sustainable Tourism, 27(9), 1355–1373. https://doi.org/10.1080/09669582.2019.1621883
Knowles N. L. (2019). Targeting sustainable outcomes with adventure tourism: A political ecology approach. Annals of Tourism Research, 79, 102809. https://doi.org/10.1016/j.annals.2019.102809
Mackenzie S. H., & Brymer E. (2020). Conceptualizing adventurous nature sport: A positive psychology perspective. Annals of Leisure Research, 23(1), 79–91. https://doi.org/10.1080/11745398.2018.1483733
Maroudas L., Kyriakaki A., & Gouvis D. (2004). A community approach to mountain adventure tourism development. Anatolia, 15(1), 5–18. https://doi.org/10.1080/13032917.2004.9687141
Mawarni G., Moutinho N., Fernandes P. O., & Nunes A. (2022). Factors affecting the Adventure Tourism Development Index: A worldwide analysis. In Abreu A., Liberato D., & Garcia Ojeda J. C. (Eds), Advances in tourism, technology and systems. Smart innovation, systems and technologies (pp. 371–383). Springer. https://doi.org/10.1007/978–981–19–1040–1_32
Otieno V. A., Kariuki A. C., & Kipkosgei B. (2025). Types of adventure tourism product and sustainable tourism development in Nakuru County, Kenya. Journal of Hospitality and Tourism Management, 8(1), 93–110. https://doi.org/10.53819/81018102t5382
Reihanian A., Mahmood N. Z. B., Kahrom E., & Hin T. W. (2012). Sustainable tourism development strategy by SWOT analysis: Boujagh National Park, Iran. Tourism Management Perspectives, 4, 223–228. https://doi.org/10.1016/j.tmp.2012.08.005
Saaty T. L. (1977). A scaling method for priorities in hierarchical structures. Journal of Mathematical Psychology, 15(3), 234–281. https://doi.org/10.1016/0022–2496(77)90033–5
Saaty T. L. (1980). The analytic hierarchy process. McGraw–Hill.
Saaty T. L. (2008). Decision making with the analytic hierarchy process. International Journal of Services Sciences, 1(1), 83–98. https://doi.org/10.1504/IJSSCI.2008.017590
Saaty T. L., & Vargas L. G. (1991). Prediction, projection and forecasting. Kluwer Academic Publishers.
Sahoo D., Nukhu R., Dash S., & Chauhan V. (2026). Adventure tourism and visitors motivations: A mixed–method study on memorability and psychological well–being. Journal of Hospitality and Tourism Insights, 9(3), 1385–1404. https://doi.org/10.1108/jhti–04–2025–0466
Sirakaya E., Teye V., & Sönmez S. (2002). Understanding residents’ support for tourism development in the central region of Ghana. Journal of Travel Research, 41(1), 57–67. https://doi.org/10.1177/004728750204100109
Solangi Y. A., Tan Q., Mirjat N. H., & Ali S. (2019). Evaluating the strategies for sustainable energy planning in Pakistan: An integrated SWOT–AHP and Fuzzy–TOPSIS approach. Journal of Cleaner Production, 236, 117655. https://doi.org/10.1016/j.jclepro.2019.117655
Taleai M., Mansourian A., & Sharifi A. (2009). Surveying general prospects and challenges of GIS implementation in developing countries: A SWOT–AHP approach. Journal of Geographical Systems, 11(3), 291–310. https://doi.org/10.1007/s10109–009–0089–5
Torabi Z., Rezvani M. R., Hall C. M., & Allam Z. (2023). On the post–pandemic travel boom: How capacity building and smart tourism technologies in rural areas can help—Evidence from Iran. Technological Forecasting and Social Change, 193, 122633.
